AWN CropAI Documentation – iOS
AWN CropAI is a smartphone application focuses on quantifying Fruit Surface Temperature (FST) and Berry Surface Temperature (BST) by leveraging localized weather data, a thermal-RGB imager connected to a smartphone, and machine learning. This application aids in assessing real-time sunburn risk in maturing apple fruits and grape berries, while also tracking their color progression.
1. How to View the Fruit and Berry Surface Temperature Forecast
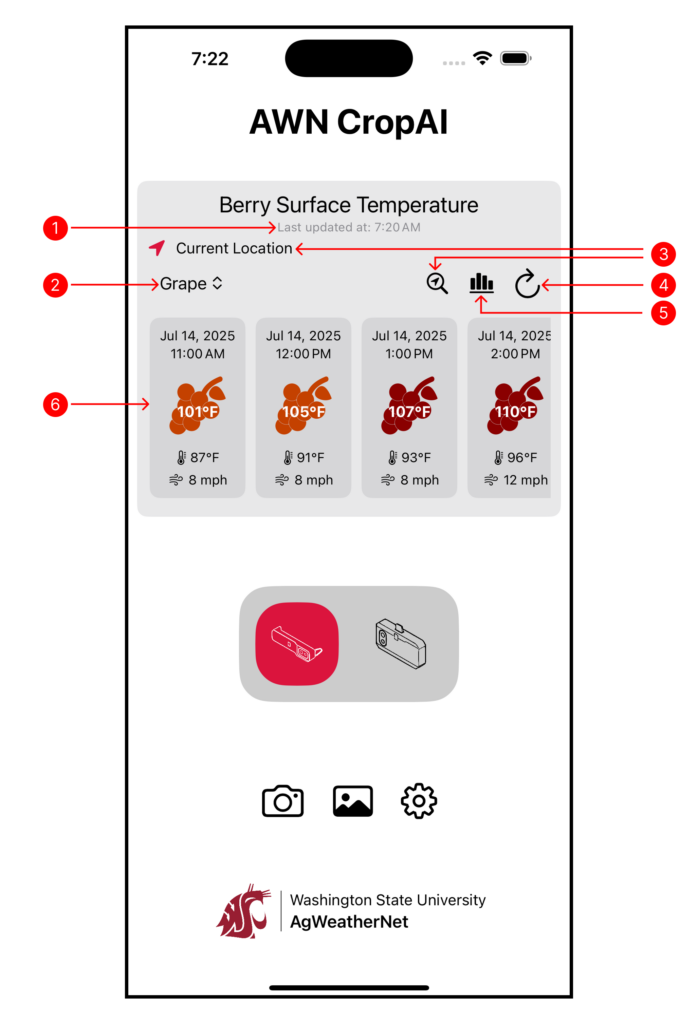
Use the Surface Temperature widget on the home page to view a 7-day forecast from 9 AM to 5 PM, tailored to your location. You can switch between fruit and berry surface temperatures using the crop selection dropdown menu within the widget, as shown in the sections below.

- This timestamp shows the last time the data was refreshed. It updates automatically whenever new data is fetched—either manually by the user or in the background.
- Use this dropdown to switch between crops. Selecting Apple displays the Fruit Surface Temperature (FST) forecast, while selecting Grape displays the Berry Surface Temperature (BST) forecast.
-
Tapping either of the location selection buttons will bring up a location switch popup, where you can search for and select a new location to be used for the berry surface temperature forecasts.
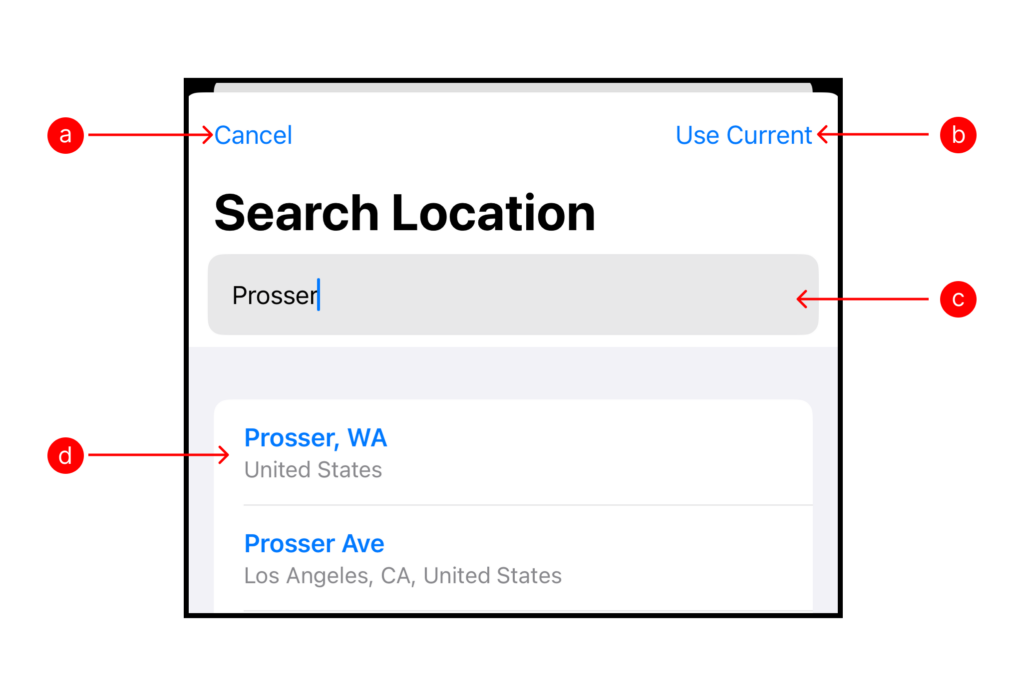
- Cancel : Tap to close the popup without making any changes.
- Use Current: Select this option to use your device’s current GPS location for the forecasts.
- Search Bar: Type the name of a city or location to search manually. As you type, matching locations will appear below.
- Location Results: Tap a result from the list to select it as your forecast location.
- Displays the daily FST forecast summary for next two days.
- Tap this button to manually refresh the forecast. The data will be updated, and the last updated time will reflect the new fetch.
-
Tap on this button to set fruit size for a more tailored forecast.

- Adjust Fruit Diameter: Use the slider or the text box to update the fruit diameter. with minimum and maximum acceptable values displayed below the slider.
- Save Changes: After adjusting the fruit diameter, click the Save button to confirm changes. A user feedback message will notify you that the fruit diameter has been updated.
- Cancel Updates: If no changes are needed, click the Cancel button to exit without updating the fruit diameter.
-
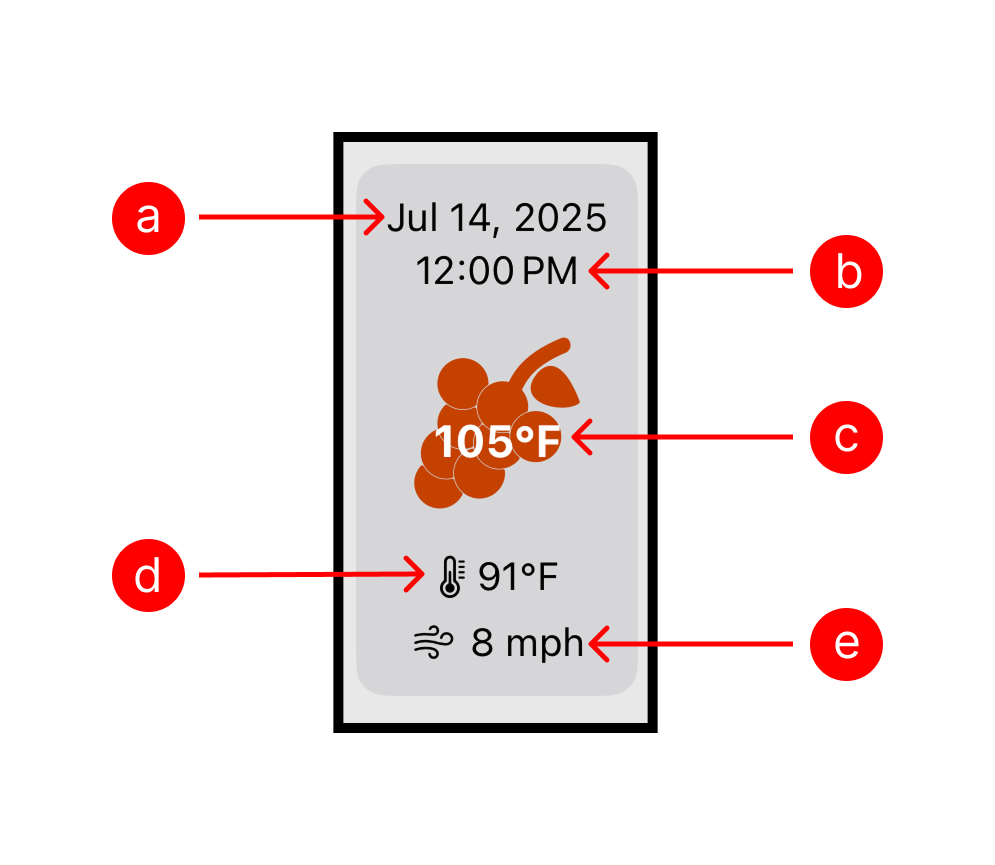
Forecast Data Cards to provide a detailed breakdown of FST forecasts and related weather insights.

- Date: Displays the date of the forecasted data.
- Time: Indicates the hour for which the forecast applies.
-
Forecasted FST and Sunburn Risk: Displays the predicted Fruit Surface Temperature (FST) for the selected hour. The background color of the icon represents the sunburn risk level.

No Risk. FST < 95°F 
Medium Risk. FST < 113°F 
High Risk. FST < 124°F 
Severe Risk. FST ≥ 124°F - Forecasted Air Temperature: Displays the forecasted ambient air temperature.
- Forecasted wind speed: Displays the forecasted wind speed.
- This timestamp shows the last time the data was refreshed. It updates automatically whenever new data is fetched—either manually by the user or in the background.
- Use this dropdown to switch between crops. Selecting Apple displays the Fruit Surface Temperature (FST) forecast, while selecting Grape displays the Berry Surface Temperature (BST) forecast.
-
Tapping either of the location selection buttons will bring up a location switch popup, where you can search for and select a new location to be used for the berry surface temperature forecasts.
- Cancel : Tap to close the popup without making any changes.
- Use Current: Select this option to use your device’s current GPS location for the forecasts.
- Search Bar: Type the name of a city or location to search manually. As you type, matching locations will appear below.
- Location Results: Tap a result from the list to select it as your forecast location.
- Tap this button to manually refresh the forecast. The data will be updated, and the last updated time will reflect the new fetch.
- Displays the daily BST forecast summary for next two days.
-
Forecast Data Cards to provide a detailed breakdown of FST forecasts and related weather insights.
- Date: Displays the date of the forecasted data.
- Time: Indicates the hour for which the forecast applies.
-
Forecasted BST and Sunburn Risk: Displays the predicted Berry Surface Temperature (BST) for the selected hour. The background color of the icon represents the sunburn risk level.
No Risk. BST < 80°F 
Medium Risk. BST < 95°F 
High Risk. BST < 105°F 
Severe Risk. BST ≥ 105°F - Forecasted Air Temperature: Displays the forecasted ambient air temperature.
- Forecasted wind speed: Displays the forecasted ambient air temperature.
2: How to connect Thermal Camera
Users can estimate fruit surface temperature (FST) and analyze fruit color in real-time by connecting a compatible thermal-RGB camera.
2.1: Compatible Thermal-RGB Cameras
AWN CropAI is compatible with the following thermal-RGB camera models:
FLIR One Edge®/One Edge Pro®:
- Wireless thermal-RGB cameras.
- Requires cellular data to work with AWN CropAI.
• FLIR One®/One Pro®:
- Thermal-RGB cameras with USB-C/Lightning connectors.
- Recommended if your mobile device connects to the internet via WiFi.
2.2: Connecting FLIR Thermal-RGB Camera
This section provides instructions for connecting a FLIR thermal-RGB camera, enabling users to capture thermal images and analyze crop health insights.

- Connectivity Options:
- Wireless Camera: Select this option if you want to connect to a wireless camera, such as the FLIR ONE Edge Pro.
- USB Camera: Choose this option if you prefer to connect a USB camera, like the FLIR ONE Pro (Gen 3).
- Camera Connection Process:
- Camera Button: After selecting the camera type, tap the Camera button to establish the connection. Once connected, the app will take you to the next screen where you can capture a thermal image. After capturing the image, the system will process it to provide crop health insights.
3: How to capture an Image
This section provides details and options available on the Image Capturing page, allowing users to fine-tune thermal imaging settings before capturing an image.
Allow the thermal camera to warm up for 60 seconds before capturing images to ensure accuracy.

- Station Selection: To change the station or modify the parameters, refer 4.
-
Palette Selection: Change the color palette used for thermal visualization. Available options include Iron, Rainbow, Arctic, Lava, Gray, and Isotherms.

- Temperature Spot: Select this button to check the temperature at a specific point in the thermal image.
- Calibration: Perform a calibration to ensure accurate thermal readings.
- Settings: Opens the general settings page, where users can adjust preferences and disconnect the connected FLIR camera.
- Capture: Press this button to take a thermal image. The captured image will be processed for analysis, and all saved images will be stored in the AWN CropAI library within the Photos app.
Station Button: Allows users to change the station. By default, the nearest station is selected based on the user’s location. Stations are sorted for easy selection, with the closest appearing at the top.

Manual Entry: Tap the edit button, then select the Manual Entry button to manually enter air temperature and relative humidity before applying changes.

- Refresh Button: Updates data for the selected station.
- Station Selection: To change the station or modify the parameters, refer 4.
Crop Selection: Choose a crop from the available options.

Cultivar Selection: Select the appropriate cultivar for the chosen crop to refine the analysis.

- FST Button: Click this button after verifying that all parameters and details are correct. The system will then process the image and navigate to the results page, where crucial insights for agricultural decision-making will be provided.
- Station Selection: To change the station or modify the parameters, refer 4.
Crop Selection: Choose a crop from the available options.

Cultivar Selection: Select the appropriate cultivar for the chosen crop to refine the analysis.

- BST Button: Click this button after verifying that all parameters and details are correct. The system will then process the image and navigate to the results page, where crucial insights for agricultural decision-making will be provided.
- FST View: Displays the thermal segmented fruit image along with extracted FST values and sunburn risk severity.
- Thermal Scale: Shows the minimum and maximum FST values, providing a reference for temperature variation within the image.
- Original View: Presents the captured thermal image along with the analysis results.
Color View: Displays the segmented color image, highlighting the percentage of red, yellow, and green areas in the fruit. This helps with decision-making based on color distribution.

- FST (Result): Displays the extracted Fruit Surface Temperature (FST) value based on image analysis.
- Sunburn Risk (Result): Provides sunburn risk severity categorized as No Risk, Medium, High, or Severe, assisting users in assessing potential crop damage.
- Color Analysis (Result): Shows the percentage of red, yellow, and green in the segmented fruit image, helping users make color-based decisions for crop assessment.
- BST View: Displays the thermal segmented fruit image along with extracted BST values and sunburn risk severity.
- Thermal Scale: Shows the minimum and maximum BST values, providing a reference for temperature variation within the image.
- Original View: Presents the clicked thermal image along with the analysis results.
Color View: Displays the segmented color image, highlighting the percentage of red, yellow, and green areas in the fruit. This helps with decision-making based on color distribution.

- BST (Result): Displays the extracted Berry Surface Temperature (BST) value based on image analysis.
- Sunburn Risk (Result): Provides sunburn risk severity categorized as No Risk, Medium, High, or Severe, assisting users in assessing potential crop damage.
- Color Analysis (Result): Shows the percentage of red, yellow, and green in the segmented fruit image, helping users make color-based decisions for crop assessment.
-
Units Selection: Allows users to switch between Metric and Imperial units based on preference:
- Metric: Temperature (°C), Distance (km), Speed (km/h)
- Imperial: Temperature (°F), Distance (miles), Speed (mph)
Data Storage Consent: Provides a consent form for image storage. If the user agrees, the app is permitted to save captured images for further enhancement and future research. Users can enable or disable this option anytime within settings.

Device Information: Displays the connection status of the FLIR camera and available metadata. Users also have the option to disconnect the FLIR camera from this section.

Knowledge Center: Contains all technical details and literature explaining the core functionality behind the app. It changes based on the selection of crop (FST/BST).

BST Knowledge Center 
FST Knowledge Center - AWN CropAI Documentation: Redirects users to the official documentation webpage, outlining the app’s features and usage instructions in detail.
- About Us: Provides information on the authors and developers involved in the project, along with acknowledgments. Users also have the option to connect via email or LinkedIn.
- Support: Allows users to send an email directly from the app regarding any issues or concerns. The support team will respond to assist in resolving the problem.
4. How to Change the Station and Modify the Parameters
This section provides options to modify parameters either by changing the station or by manually entering values for more precise analysis.

5: How to Get Fruit Surface Temperature(FST)/ Berry Surface Temperature(BST) and Color Analysis
This section outlines the available options on the Image Preview Page, where users can modify parameters to extract Fruit Surface Temperature (FST)/ Berry Surface Temperature (BST) and perform color analysis on the provided image.


6: How to Interpret the Results
This section provides details of the results displayed after processing the thermal image, including Fruit Surface Temperature (FST) values, color percentages, and sunburn risk assessment.

Note: Users can swipe to toggle between different result views on this page for easy comparison.

Note: Users can swipe to toggle between different result views on this page for easy comparison.
7: How to Use Settings
This section provides an overview of the Settings Page, where users can customize preferences, manage device connectivity, and access detailed app information.
