Precision Crop Load Management at WSU Smart Apple Orchard Testbed
Industry partners: Innov8.Ag Pvt Co. with Green Atlas Pty Ltd., Vivid Machines Inc., Tyton Aviation Pvt Co. with Outfield Technologies Ltd.
WSU Team: Dattatray Bhalekar, Juan Munguia, Lav Khot, Bernardita Sallato
In 2024, our efforts have been focused on evaluating various ground (Innov8.Ag with Green Atlas and Vivid Machines) and aerial (Tyton Aviation with Outfield Technologies) imaging-based mapping solutions at the testbed. Each technology provider maps the orchard block for estimating crop parameters, including blossom count, fruit size, and fruit count. The WSU research team collects pertinent ground truth data to validate the estimated crop attributes.
In season 2024, several scanning campaigns were conducted by the above three technology providers in the smart orchard (cv. WA38) testbed. Grower cooperator was also using services of Orchard Robotics to map the crop attributes.
All these vendors provide a block-wise summary report of estimated crop parameters (PDF files) and processed data (CSV files). Innov8.Ag and Vivid Machines provide variability maps as shape files, whereas the processed data from Outfield Technologies can be exported as TIFF files (raster data). WSU team has generated the variability maps, as shown below, of average blossom clusters and fruit count using QGIS software.
As a ground truth, the WSU team manually collected blossom cluster count data on April 18, 2024. Data was collected at three zones within the orchard block with 12-15 trees per zone. Also, fruit size (biweekly) and count (at key stages) data were collected at four different zones with five trees per zone. The fruit size (diameter) was quantified from five randomly selected apples per tree using a vernier caliper. Collected data was compared with estimates provided by the vendors.
Innov8.Ag with Green Atlas
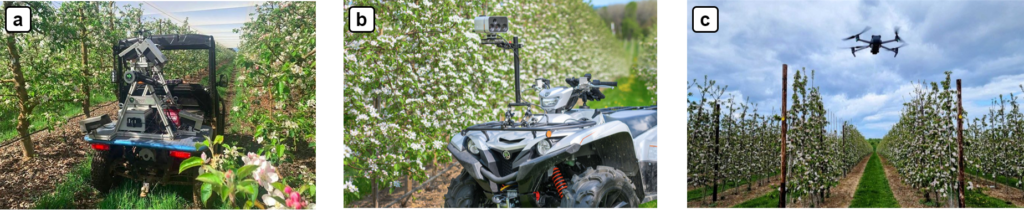
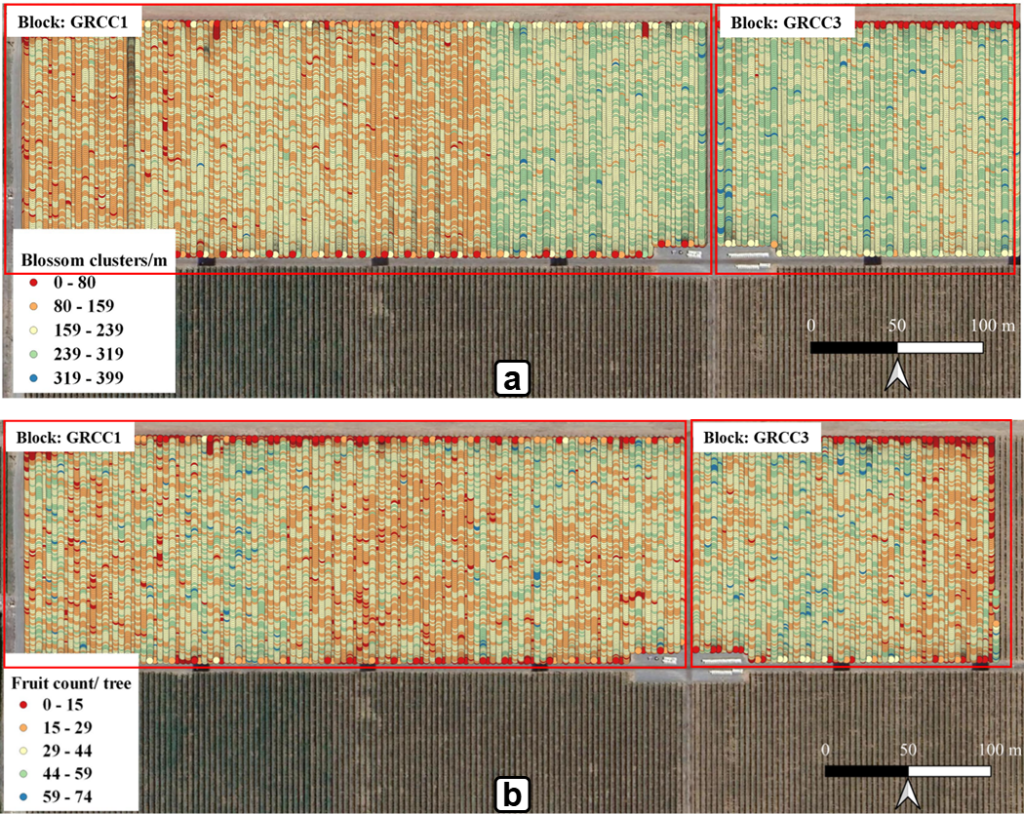
Innov8.Ag uses Green Atlas Cartographer, a commercial sensing platform (Figure 1a) equipped with multiple sensors, including a 2D-LiDAR, high-resolution RGB cameras with strobe lights, and a GPS receiver. This hardware and machine learning algorithms are integrated and mounted on an all-terrain vehicle (ATV). The cartographer can be driven at 12.5 mph to collect the raw imagery data. Pertinent data is post-processed using propriety algorithms to generate the variability maps (Figure 2) of estimated crop parameters such as bud count (per leaf area, m2), blossom cluster (per meter), canopy geometry (per tree), and fruit count, size as well as color at tree-level.
For the orchard scans on June 5 and September 25, fruit size (mean ± SD, 38.3 ± 7.4 mm and 81.4 ± 6.7 mm) estimates were comparable to ground truth (33.3 ± 4.88 and 83.1 ± 5.6 mm) measurements.
Vivid Machines Inc.
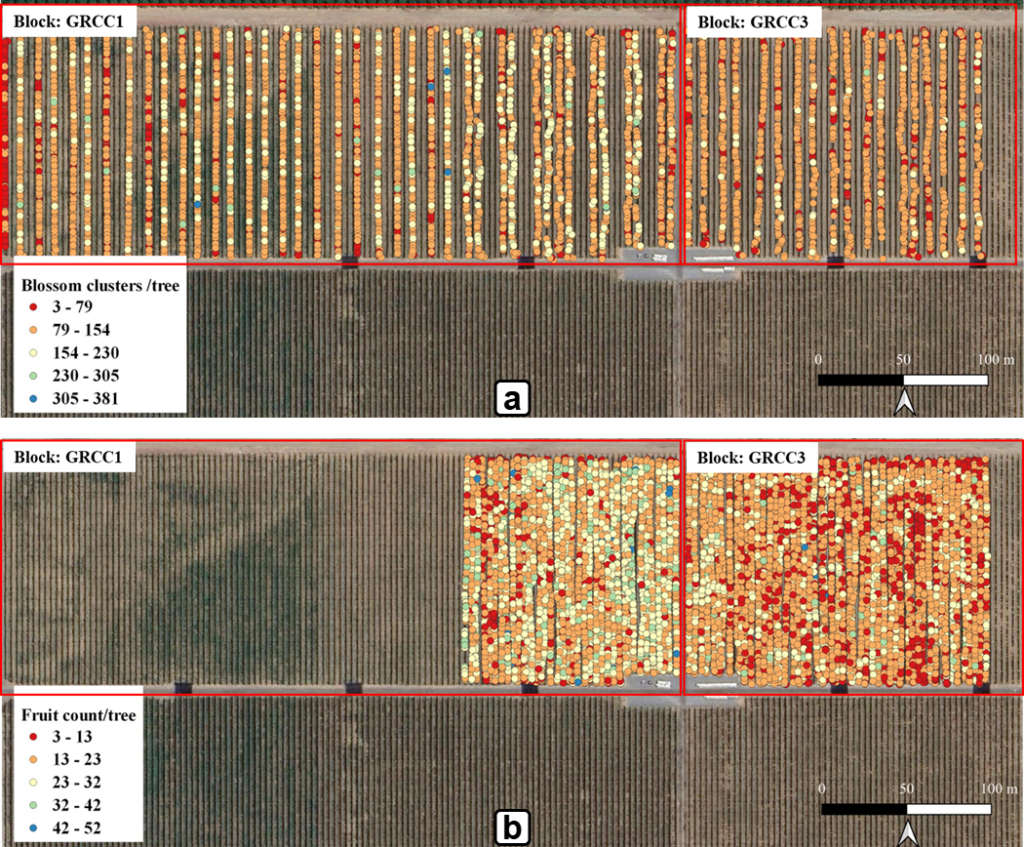
The Vivid XV3 Vision System comprises a multispectral sensor capturing multiple bands in visible and near-infrared (VIS-NIR) spectral range, a GPS receiver, and an integrated propriety data processing algorithm. The system can be universally mounted on any farm vehicle (Figure 1b) to scan the block at 5-10 mph. The onboard vision system is capable of scanning, processing, and providing real-time estimates for up to 20,000 trees/hour. Pertinent mapping technique can generate variability maps of estimated crop parameters at tree-level resolution. The variability maps (Figure 3), processed data, and scanning reports can be accessed remotely using a smartphone with the Vivid Control App or cloud-based dashboards.
On April 18, 2024, Vivid Machines estimated an average blossom cluster count (mean ± SD) of 108.6 ± 35.6 clusters/tree, relating closely with the ground truth (131.4 ± 56.8 clusters/tree). Moreover, the estimated fruit count per tree on July 18, 2024, (22.5 ± 7.1) and August 26, 2024, (19.8 ± 6.9) were comparable with respective ground truth counts of 19.1 ± 11.4 and 20.9 ± 11.7 fruits/tree, respectively.
In terms of fruit size, Vivid Machines consistently provided estimates close to ground truth data throughout the season. Estimated fruit size on July 18, August 2, and August 15, 2024, were 60.5 ± 10.8, 67.0 ± 6.4, and 77.3 ± 4.6 mm, whereas measured fruit size on pertinent dates were 61.9 ± 4.7, 69.2 ± 4.7, and 77.3 ± 4.6 mm, respectively.
Tyton Aviation with Outfield Technology
The Tyton Aviation and Outfield Technologies are collaborating in WA State. They use an unmanned aerial vehicle (UAV, Mavic 3 Enterprise Multispectral RTK, DJI Technologies) equipped with an integrated, gimbaled RGB camera (4/3” CMOS Hasselblad 20MP, DJI Technologies) collecting images at 5280×3956 pixels through a mechanical shutter. This unit (Figure 1c) also has multispectral imaging capabilities, with four dedicated 1/3” sensors covering Green, Red, Red-Edge, and Near-Infrared bands. All imagery has high geospatial accuracy, with Real-Time Kinematics (RTK) combined with multiple GPS receivers and backed with an available base station. During the 2024 season flight campaigns, the UAV was flown at an altitude of 25 feet AGL and 11 mph forward speed with 45° sensor orientation, providing a complete side-view of the tree from trunk to top. These flight parameters may allow users to scan the orchard at 40 acres/h (including setup and battery changes), with a data processing time of 24 hours.
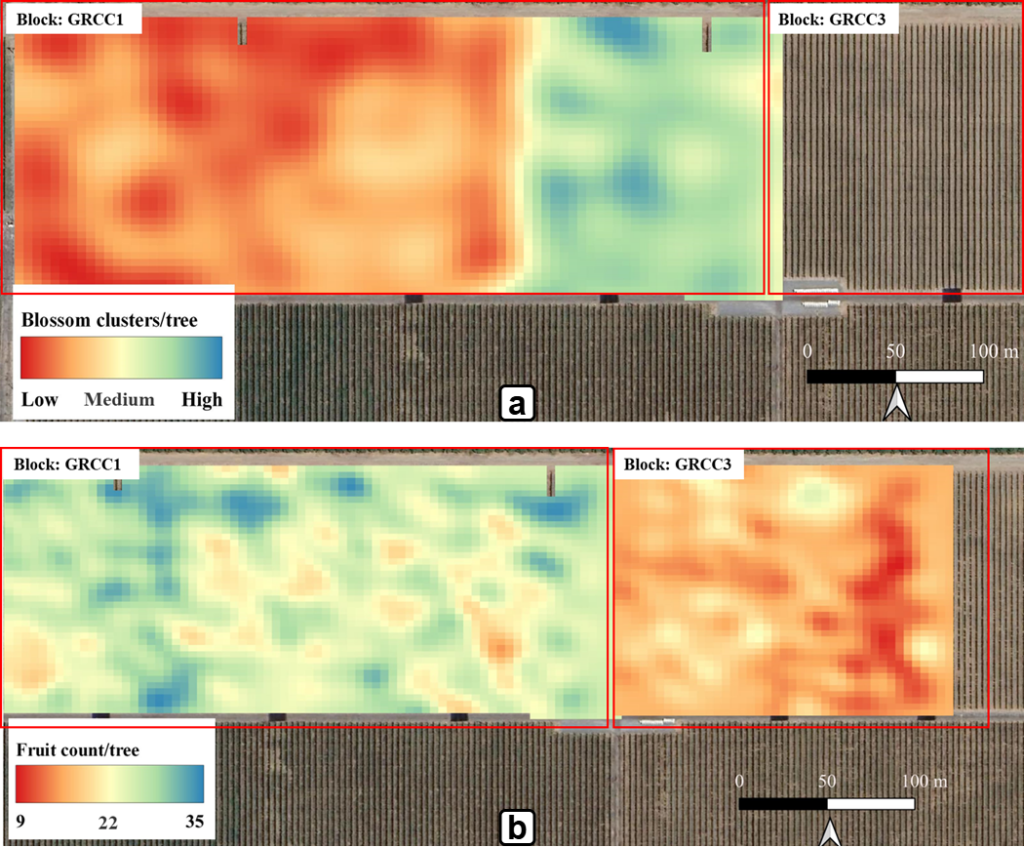
Outfield Technologies process the acquired raw data using proprietary computer vision algorithms to create an orchard-specific variability map. The algorithm is capable of detecting fruits even in fields with overhead netting. For most applications, this technique generates maps (Figure 4) of average estimated crop parameters, displayed in a 5×5 m grid, based on sampling 60% of the trees. However, this technique can also generate tree-level data with 100% tree coverage for tree-level blossom or fruit-thinning applications.
In 2024 season, pertinent aerial mapping provided numerically comparable fruit count (per tree) estimates to ground truth data throughout the growing season. On July 18, 2024, an estimated fruit count was 16.3 ± 5.2 fruits/tree, whereas the ground truth count was 19.1 ± 11.4 fruits/tree. Additionally, on August 26 and September 25, 2024, the estimated per tree crop load was 20.3 ± 6.3 and 22.2 ± 5.3, relating closely with ground truth of 20.9 ± 11.7 and 19.4 ± 11.0 fruits/tree, respectively.
2025 – 2026 Season Focus
We will continue to evaluate the applicability of crop load mapping technologies. All providers are generating crop load and size variability maps at varied spatial resolutions, either in 2D or 3D formats, to show within-tree variability. Vendors already map canopy vigor, and a couple of vendors are experimenting with mapping within-tree nutrient variation.
Besides crop load monitoring, we plan to use the mapped data for real-time management. For example, a 2D blossom variability map can be used for precision chemical thinning. The WSU team is also exploring a new collaboration with a web-based farm management platform, Agromanager, which enables the creation of block-level task maps. In the upcoming seasons, depending on how mature the application technology gets, we plan to use blossom variability-driven task maps generated by either vendors or via the Agromanager platform to do precision chemical blossom thinning. WTFRC has funded a project for WSU researchers (PIs: Gwen-Alyn Hoheisel, Lav Khot) to optimize new automated and precision sprayers. Our plan is to potentially use the optimized precision sprayer (single-row unit, Munckhof Mfgs., Netherlands) for this purpose.